

- New Study on Aviation Data: A new study analyzed NTSB data to calculate the density of Boeing crash incidents per square mile in each U.S. state.
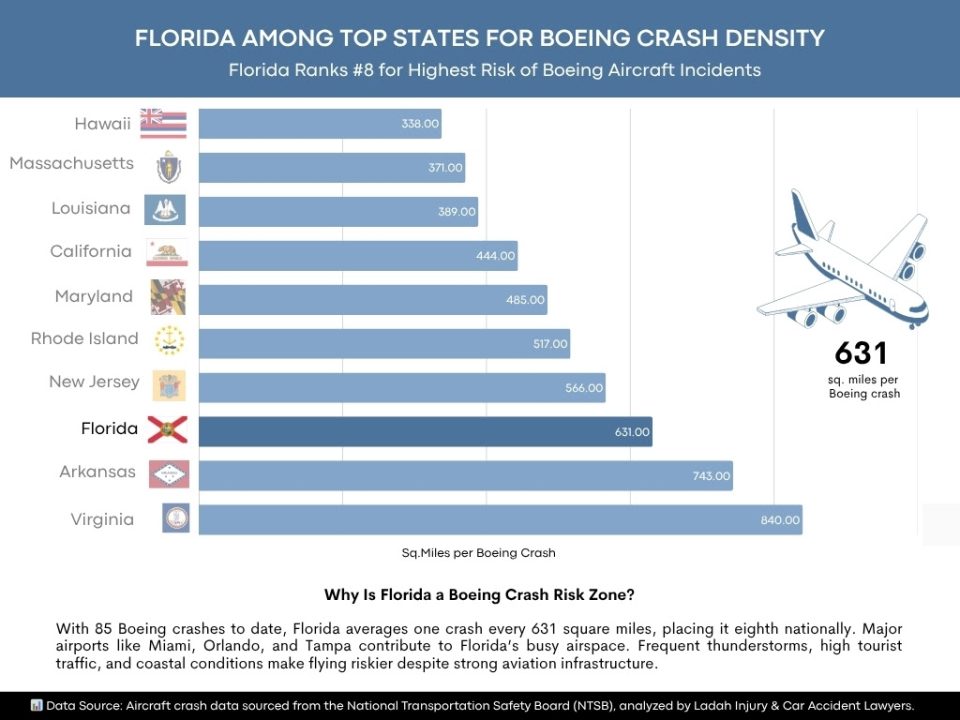
- Florida’s Ranking: The research found that Florida has the eighth-highest Boeing crash density rate in the United States.
- Contributing Factors: The study notes that high air traffic volume, complex weather, and flight path density are key factors contributing to incident rates in busy states.
- Emphasis on Traveler Awareness: The findings encourage passengers to stay informed about airline safety records and follow all safety instructions to ensure a confident travel experience.
In a continued effort to promote traveler awareness and safety, a new study offers valuable insights into aviation patterns across the United States, with a special focus on bustling hubs like Florida. The research, conducted by Ladah Injury & Car Accident Lawyers using data from the National Transportation Safety Board (NTSB), provides travelers with information that empowers them to make well-informed decisions for their journeys.

The study analyzed the density of Boeing aircraft incidents by state, revealing that Florida ranks eighth in the nation. This finding highlights the state’s significant role as a major hub for air traffic. Factors such as high flight volumes, diverse weather patterns, and complex flight paths all contribute to the operational landscape in popular states. By understanding these dynamics, the travel industry and passengers alike can appreciate the complex and diligent work that goes into managing one of the world’s safest transportation systems.
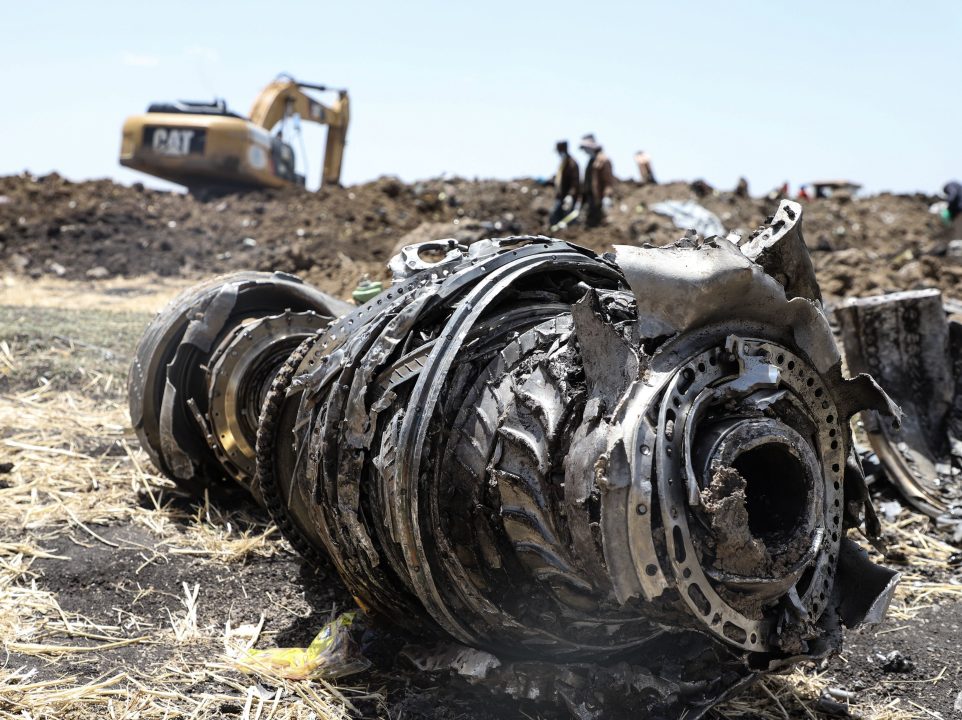
The report serves as a helpful reminder for passengers to remain engaged and proactive in their travel planning. It encourages travelers to stay informed about airline safety records and to always follow crew instructions, reinforcing the collaborative nature of ensuring a safe flight. While the study references global aviation incidents to provide context, it ultimately underscores the remarkable rarity of such events and the robust safety measures that are in place.

This data-driven analysis is a wonderful tool for the modern traveler. It fosters a deeper understanding of the aviation environment and empowers passengers to fly with even greater confidence, knowing they are well-informed and prepared.

The research by Las Vegas injury law firm, Ladah Injury & Car Accident Lawyers, analyzed aircraft crash data sourced from the National Transportation Safety Board (NTSB). The crash density rates were calculated to identify the top 10 states with the highest Boeing crash concentrations per square mile.
| State | Land Area Sq.Miles | Number of Boeing Crashes Till Date | Sq.Miles per Boeing Crash | Rank |
| Hawaii | 6423 | 19 | 338 | 1 |
| Massachusetts | 7800 | 21 | 371 | 2 |
| Louisiana | 43204 | 111 | 389 | 3 |
| California | 155779 | 351 | 444 | 4 |
| Maryland | 9707 | 20 | 485 | 5 |
| Rhode Island | 1034 | 2 | 517 | 6 |
| New Jersey | 7354 | 13 | 566 | 7 |
| Florida | 53625 | 85 | 631 | 8 |
| Arkansas | 52035 | 70 | 743 | 9 |
| Virginia | 39490 | 47 | 840 | 10 |
| Texas | 261232 | 267 | 978 | 11 |
| Mississippi | 46923 | 46 | 1020 | 12 |
| Washington | 66456 | 55 | 1208 | 13 |
| Tennessee | 41235 | 31 | 1330 | 14 |
| New York | 47126 | 34 | 1386 | 15 |
| South Carolina | 30061 | 19 | 1582 | 16 |
| Illinois | 55519 | 35 | 1586 | 17 |
| Connecticut | 4842 | 3 | 1614 | 18 |
| Indiana | 35826 | 20 | 1791 | 19 |
| Delaware | 1949 | 1 | 1949 | 20 |
| Wisconsin | 54158 | 27 | 2006 | 21 |
| Pennsylvania | 44743 | 21 | 2131 | 22 |
| Oklahoma | 68595 | 32 | 2144 | 23 |
| Georgia | 57513 | 26 | 2212 | 24 |
| West Virginia | 24038 | 10 | 2404 | 25 |
| Missouri | 68742 | 28 | 2455 | 26 |
| Kansas | 81759 | 33 | 2478 | 27 |
| Kentucky | 39486 | 15 | 2632 | 28 |
| Maine | 30843 | 11 | 2804 | 29 |
| Michigan | 56539 | 20 | 2827 | 30 |
| Ohio | 40861 | 13 | 3143 | 31 |
| Alabama | 50645 | 16 | 3165 | 32 |
| Minnesota | 79627 | 24 | 3318 | 33 |
| Idaho | 82643 | 24 | 3443 | 34 |
| Arizona | 113594 | 30 | 3786 | 35 |
| Oregon | 95988 | 25 | 3840 | 36 |
| North Carolina | 48618 | 12 | 4052 | 37 |
| Vermont | 9217 | 2 | 4609 | 38 |
| Colorado | 103642 | 18 | 5758 | 39 |
| Wyoming | 97093 | 15 | 6473 | 40 |
| Utah | 82170 | 12 | 6848 | 41 |
| North Dakota | 69001 | 8 | 8625 | 42 |
| Iowa | 55857 | 6 | 9310 | 43 |
| Nevada | 109781 | 11 | 9980 | 44 |
| New Mexico | 121298 | 12 | 10108 | 45 |
| Montana | 145546 | 12 | 12129 | 46 |
| South Dakota | 75811 | 2 | 37906 | 47 |
| Alaska | 570641 | 9 | 63405 | 48 |
| Nebraska | 76824 | 0 | #DIV/0! | 49 |
| New Hampshire | 8953 | 0 | #DIV/0! | 50 |